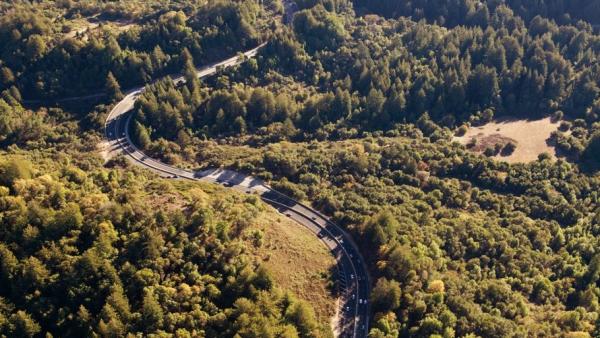
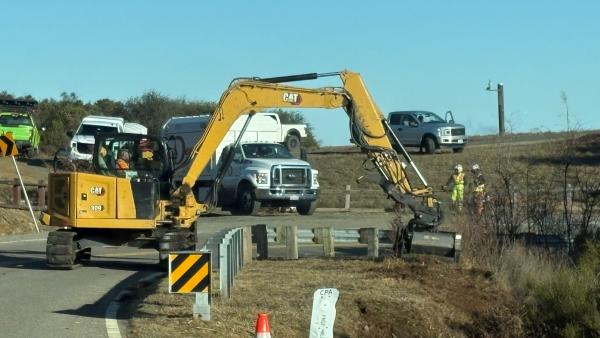
Midpen, along with our partners, have been working to find ways to create trail access at Sierra Azul while protecting migrating newts. Late last year, our project team came up with a solution.
Ever wonder what makes each Midpen preserve unique? Follow in Bay Area local, Judy Cooks’, footsteps (literally) and spend your year exploring each one.
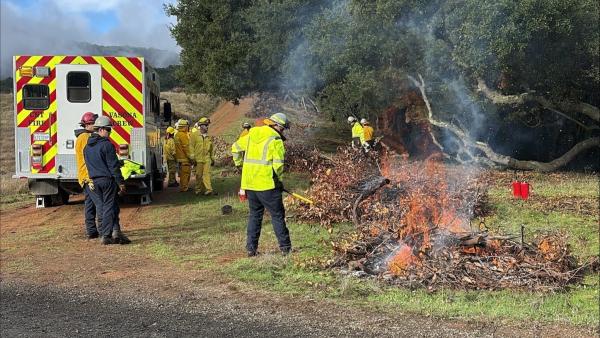
Midpen, in partnership with Santa Clara County Fire, is conducting pile-burn operations through December 2025 in a closed area of Sierra Azul Open Space Preserve. Pile burning disposes of accumulated brush and woody debris.
In several Midpen preserves, a small team of biologists and consultants have been scanning for the subtle signs of creatures that many visitors never notice.
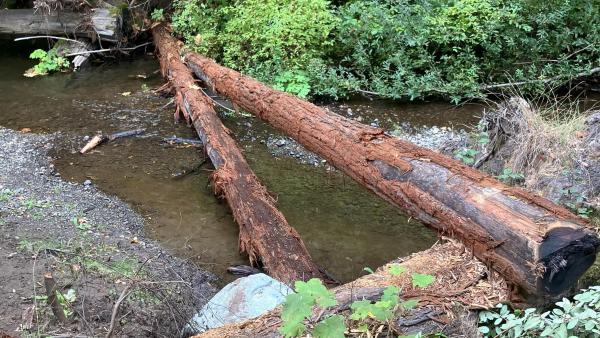
In and along San Gregorio Creek, ten newly installed pieces of large wood settle in to perform their intended function — increasing habitat complexity in the creek and creating a healthier environment for native fish species.
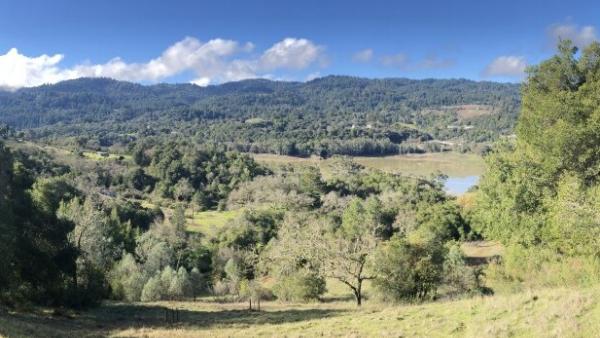
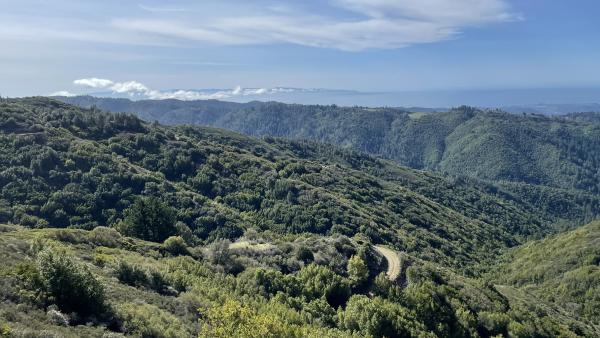
Recently, Midpen approved the acquisition of a property that supports the critical connection between two of the highest peaks in the Santa Cruz Mountains: Mount Umunhum and Loma Prieta.
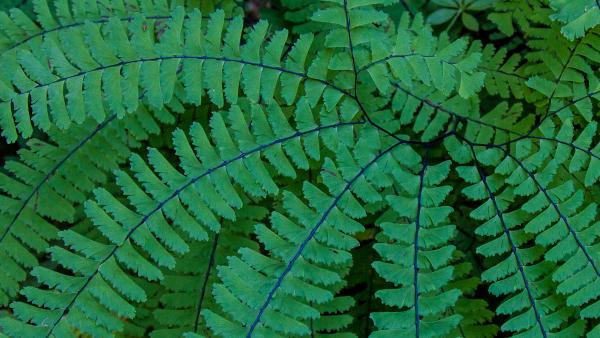
The rainy season gives a green gateway into connecting with nature through ferns. Like emerald-colored lace, these primitive plants soften the understory beneath the canopy of shrubs and trees, creating habitat while transf